Setting up an integration in Jenkins
The steps to take to integrate Jenkins with Scribe Hub
-
If you haven't yet done so, open a free Scribe Hub account here.
-
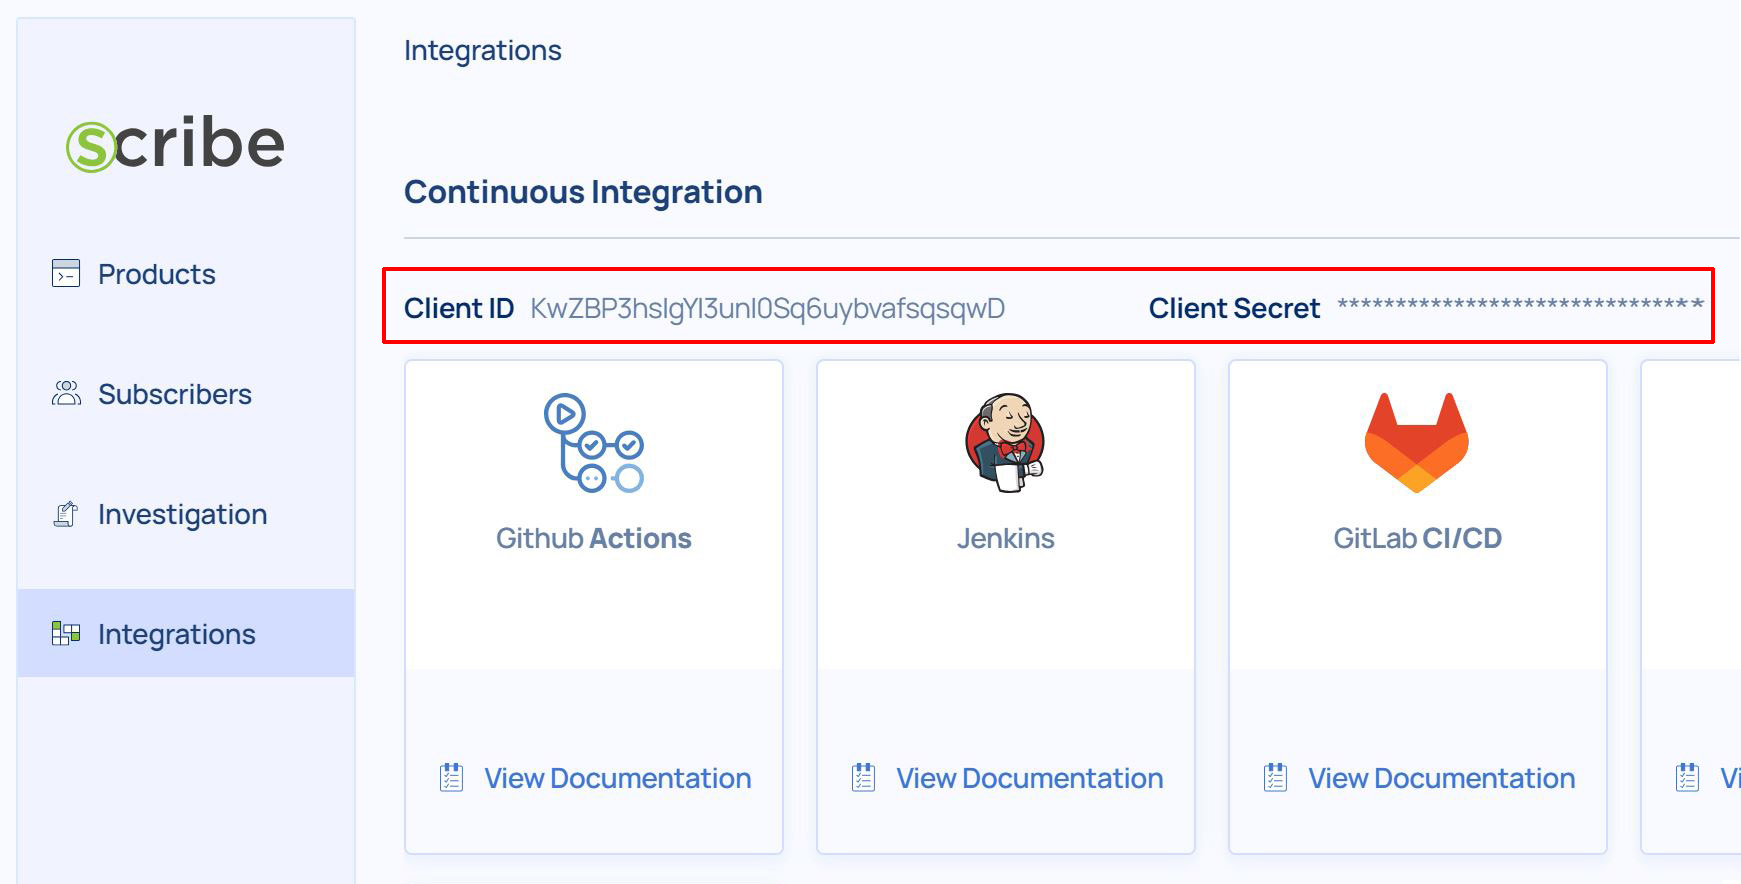
Get your Client Secret credentials from your Scribe Hub Integrations page.
- Login to your Jenkins Web Console.
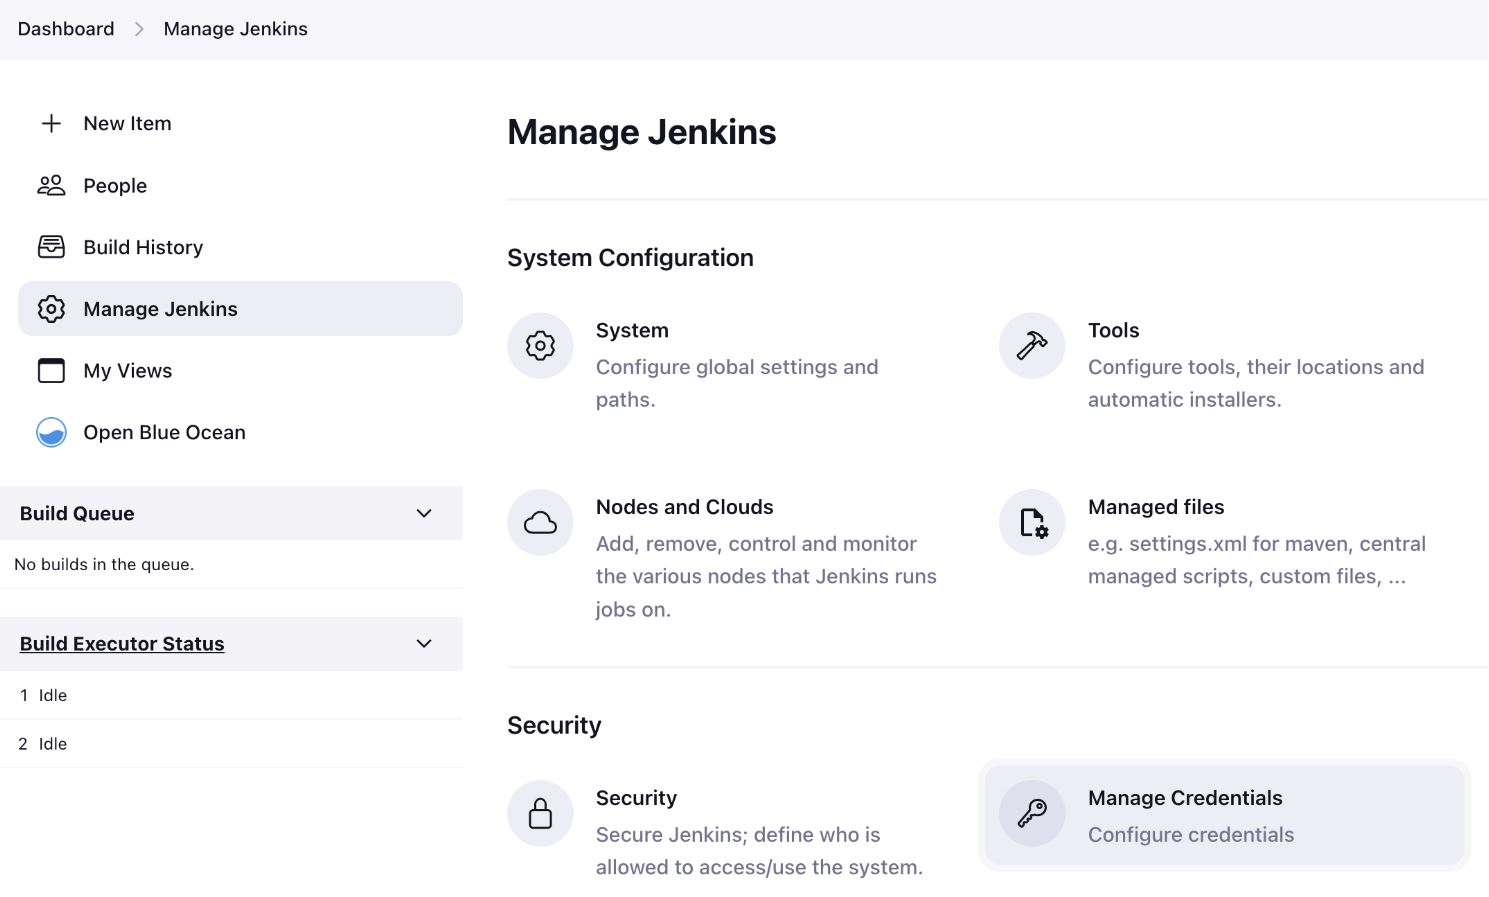
- Select Dashboard> Manage Jenkins> Manage credentials (under Security options).
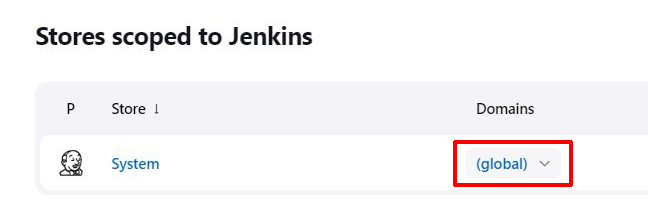
- Select 'Global' in the list of domains:
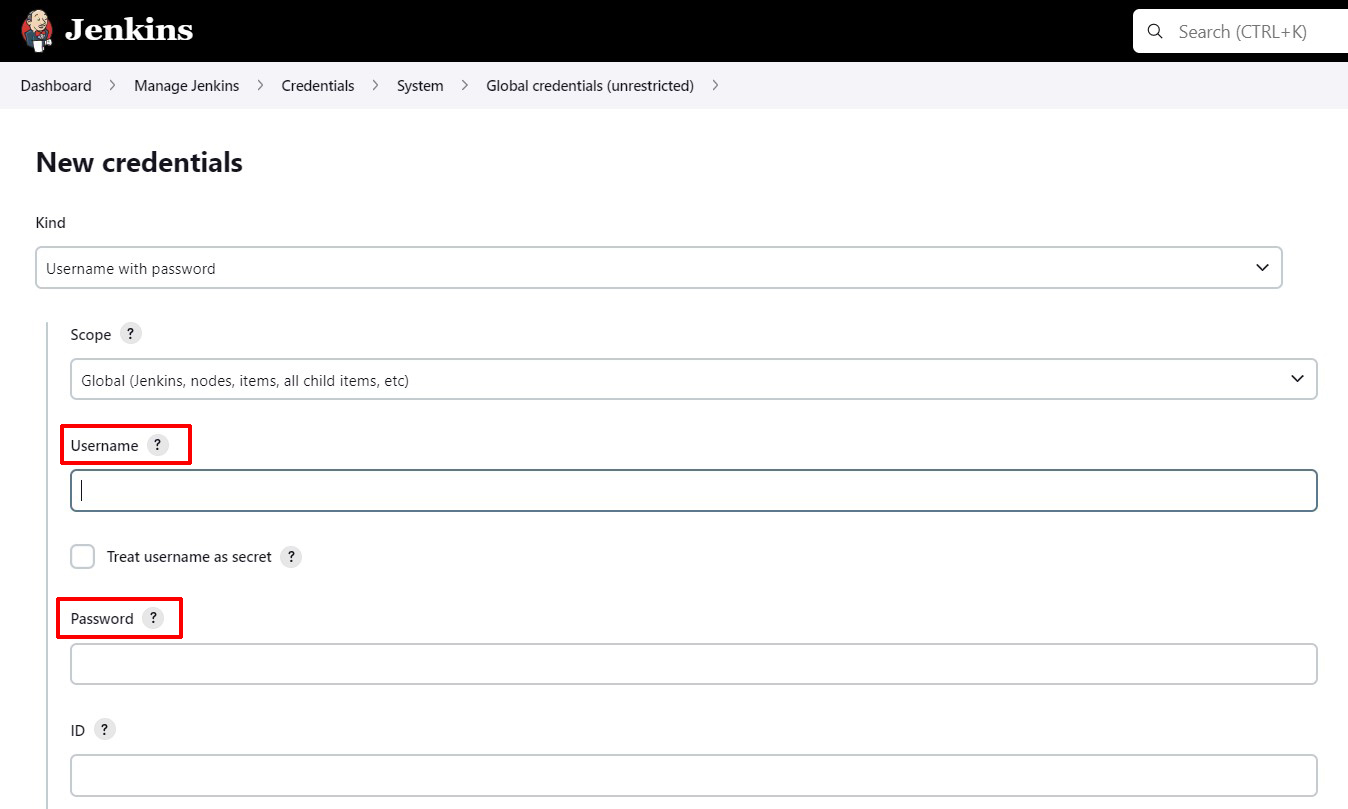
- To add Client Secret, in the Global credentials area, click + Add Credentials. A new Credentials form will open.

- Apply the Client Secret provided by Scribe to the Password, Username can be filled in with anything.
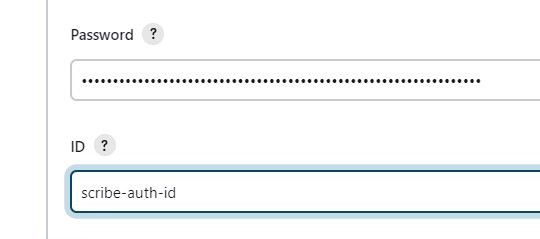
- Set ID to
scribe-auth-id(lowercase).
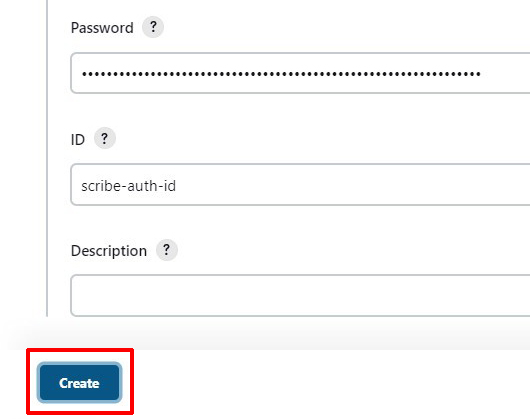
- Click Create.
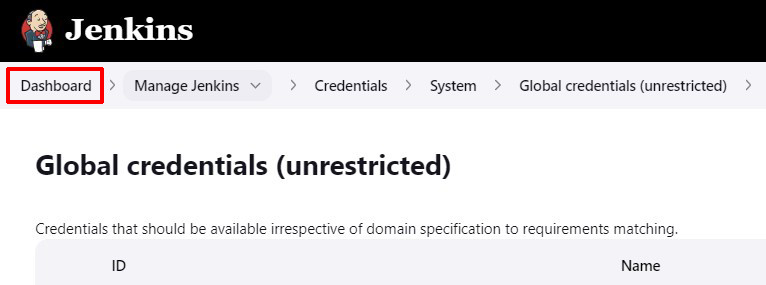
- Click on 'Dashboard' to go to the main dashboard
- Click on 'New Item'
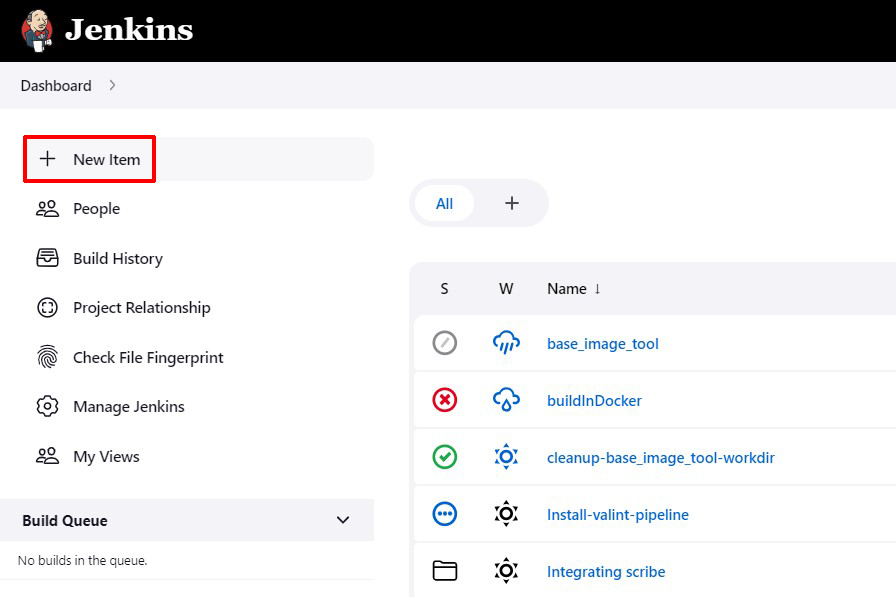
- Create a new folder such as 'integration-scribe-in-jenkins'. Click on 'New Folder' to create it once you enter the name and then click 'ok'.
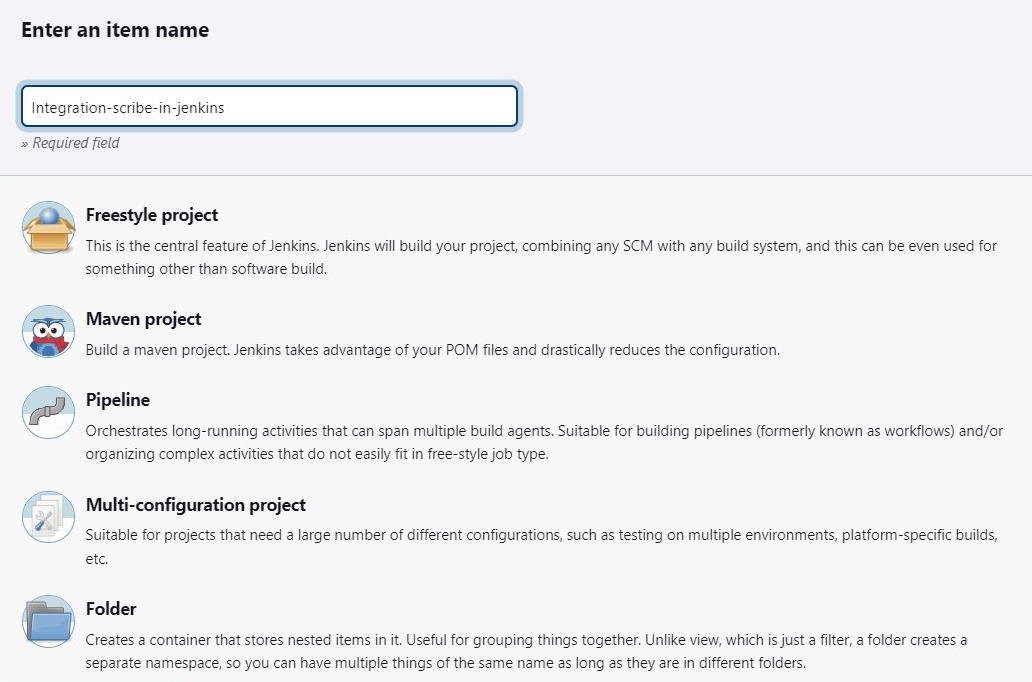
- Click 'Apply' and then 'Save'.
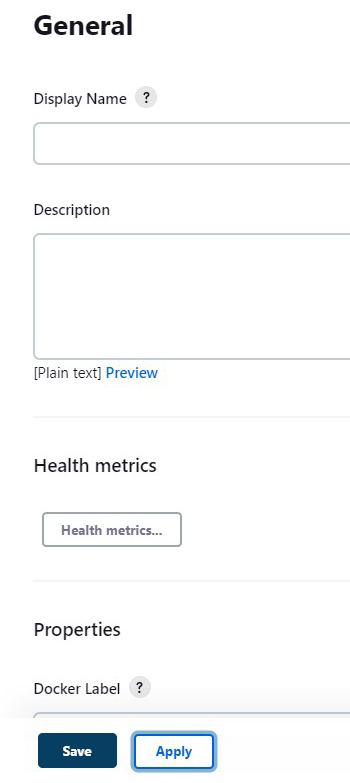
- Now to create the pipeline, click on 'New Item'
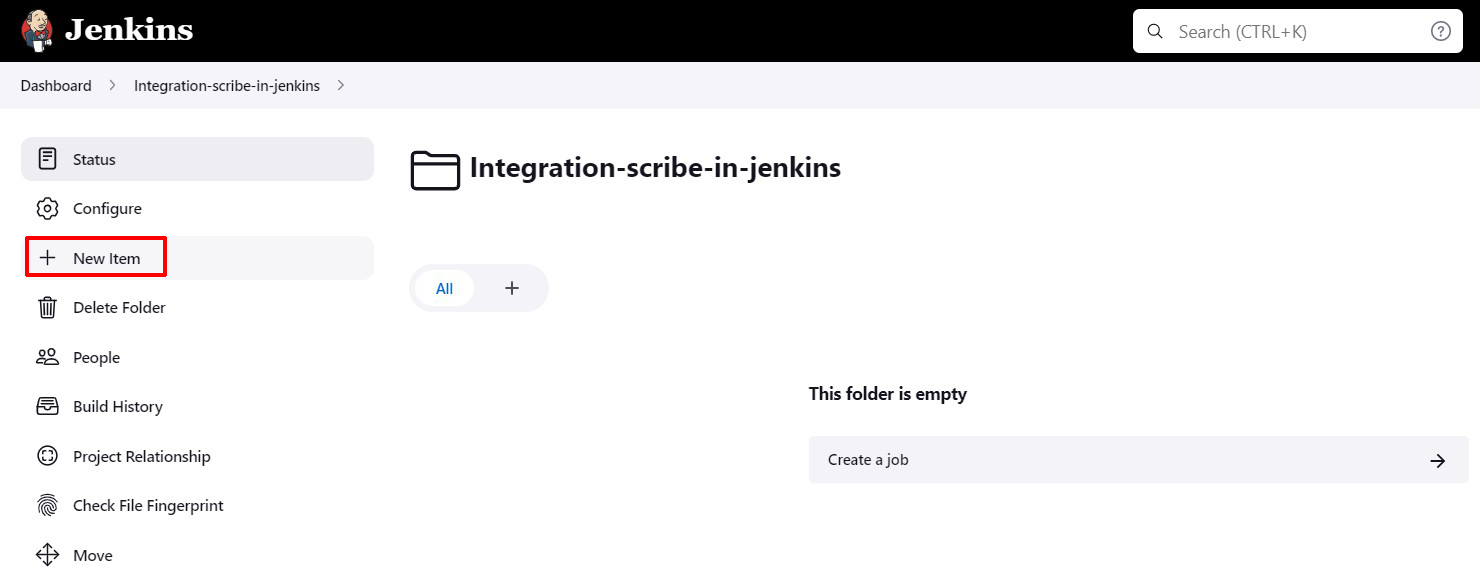
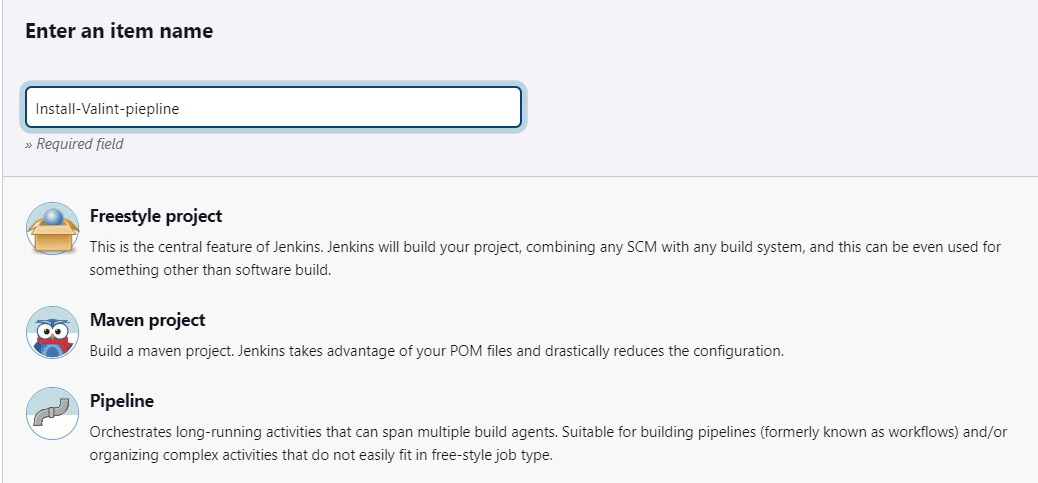
- Name it 'install-valint-pipeline'. Click on 'New Pipeline' to create it once you enter the name and then click 'ok'.
- Once you created a pipeline a new job is created. Click on the job:
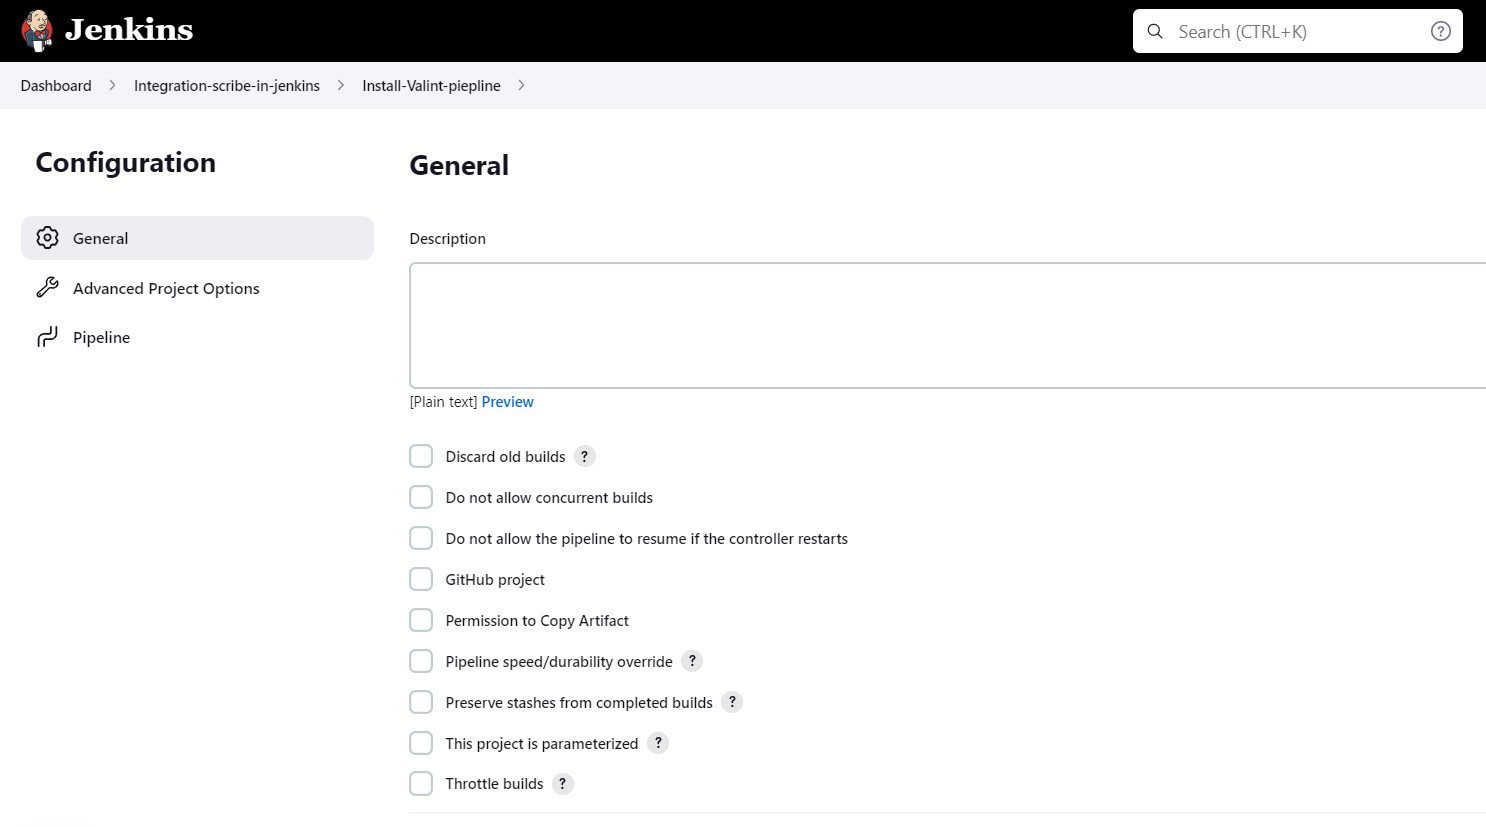
- Scroll down till you reach a 'pipeline' section and add the following script:
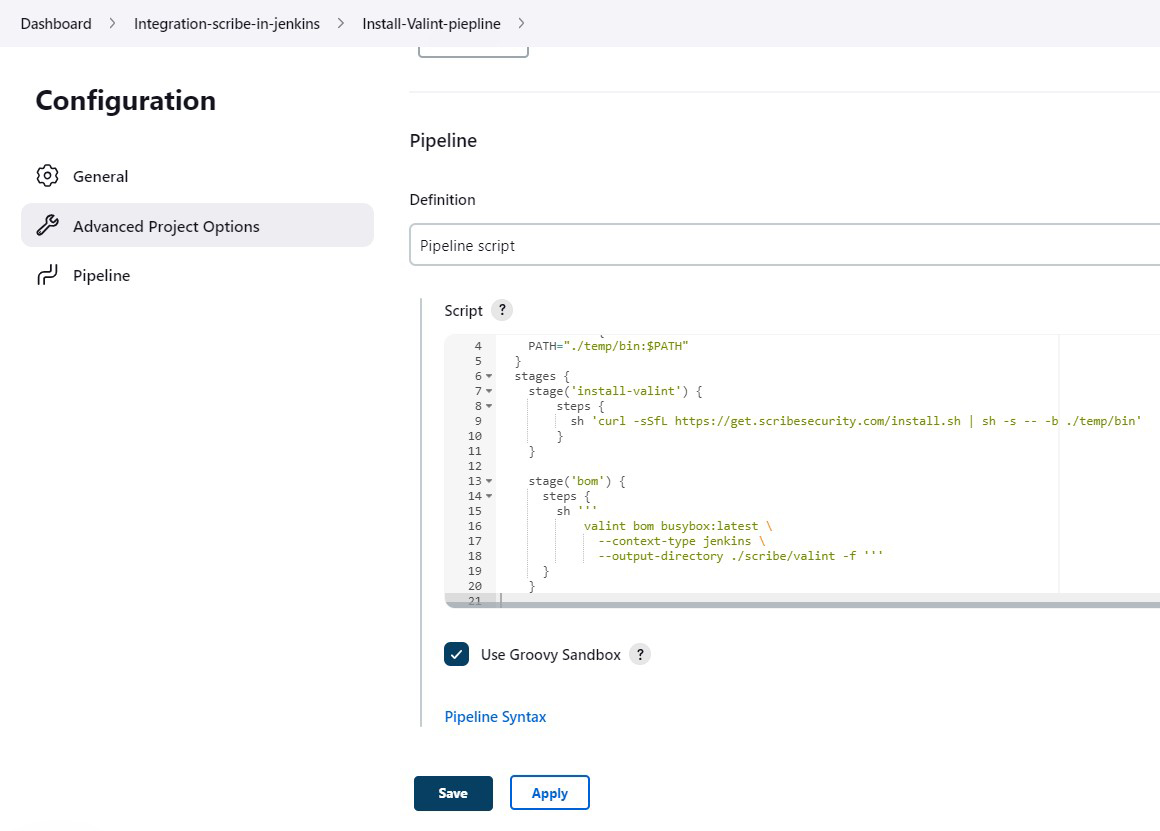
Jenkins pipeline JavaScript code example
pipeline {
  agent any
  stages {
    stage('checkout') {
      steps {
          cleanWs()
          sh 'git clone -b v1.0.0-alpha.4 --single-branch https://github.com/mongo-express/mongo-express.git mongo-express-scm'
      }
    }

    stage('sbom') {
      agent {
        docker {
          image 'scribesecurity/valint:latest'
          reuseNode true
          args "--entrypoint="
        }
      }
      steps {
        withCredentials([token(credentialsId: 'scribe-auth-id', variable: 'SCRIBE_TOKEN')]) {
        sh '''
            valint bom dir:mongo-express-scm \
            --context-type jenkins \
            --output-directory ./scribe/valint \
            -P $SCRIBE_TOKEN '''
        }
      }
    }

    stage('image-bom') {
      agent {
        docker {
          image 'scribesecurity/valint:latest'
          reuseNode true
          args "--entrypoint="
        }
      }
      steps {
            withCredentials([token(credentialsId: 'scribe-auth-id', variable: 'SCRIBE_TOKEN')]) {
            sh '''
            valint bom mongo-express:1.0.0-alpha.4 \
            --context-type jenkins \
            --output-directory ./scribe/valint \
            -P $SCRIBE_TOKEN '''
          }
      }
    }
  }
}
The above pipeline script is an example. It connects to the GitHub repository https://github.com/mongo-express/mongo-express.git, clones it and creates an image for it.
An SBOM is created after the clone is done and after the image has been created.
The above example was created under the assumption that you're using Jenkins over Docker. If you have a different version of Jenkins like Jenkins over Kubernetes (K8s) or Jenkins Vanilla (No Agent) you can find the needed JavaScript needed to create your pipeline in our full Jenkins Documentation.
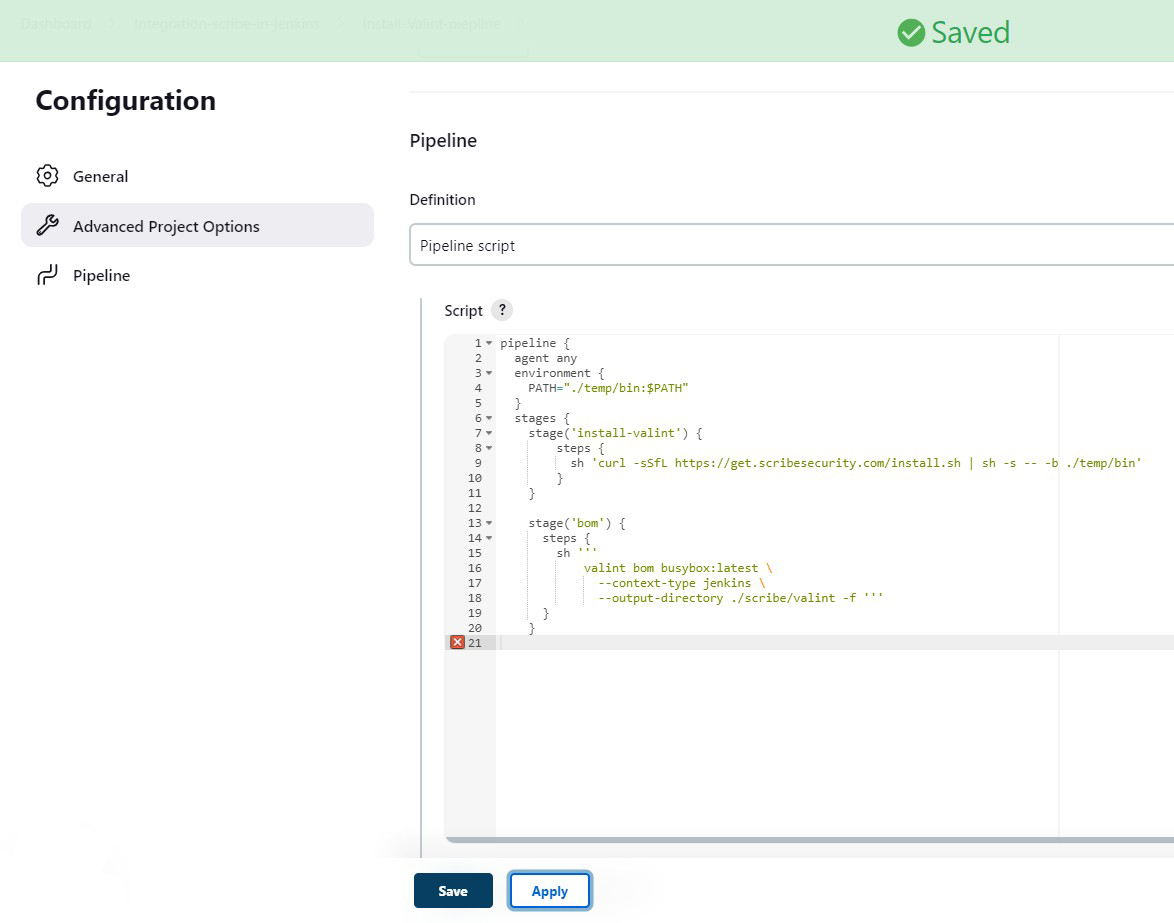
- Click 'Apply' and then 'Save'.
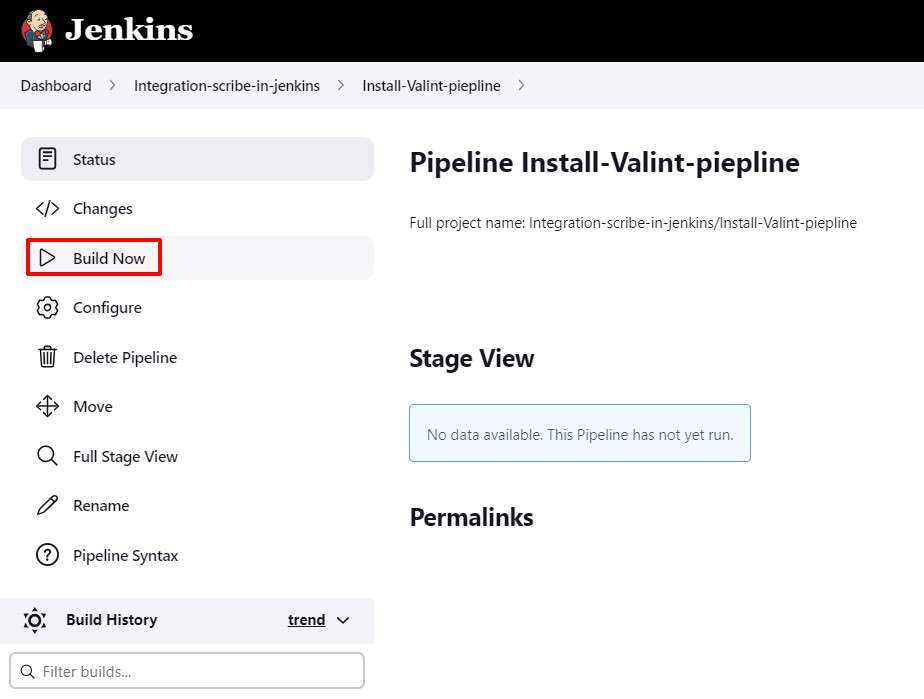
- Click on 'Build now' to run the pipeline:
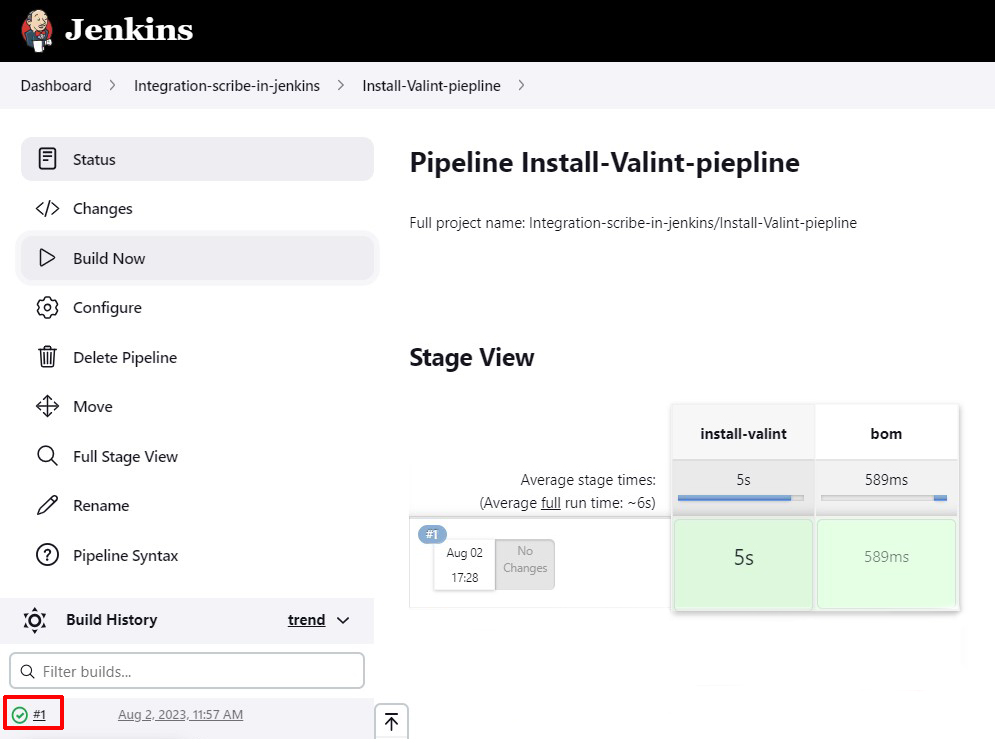
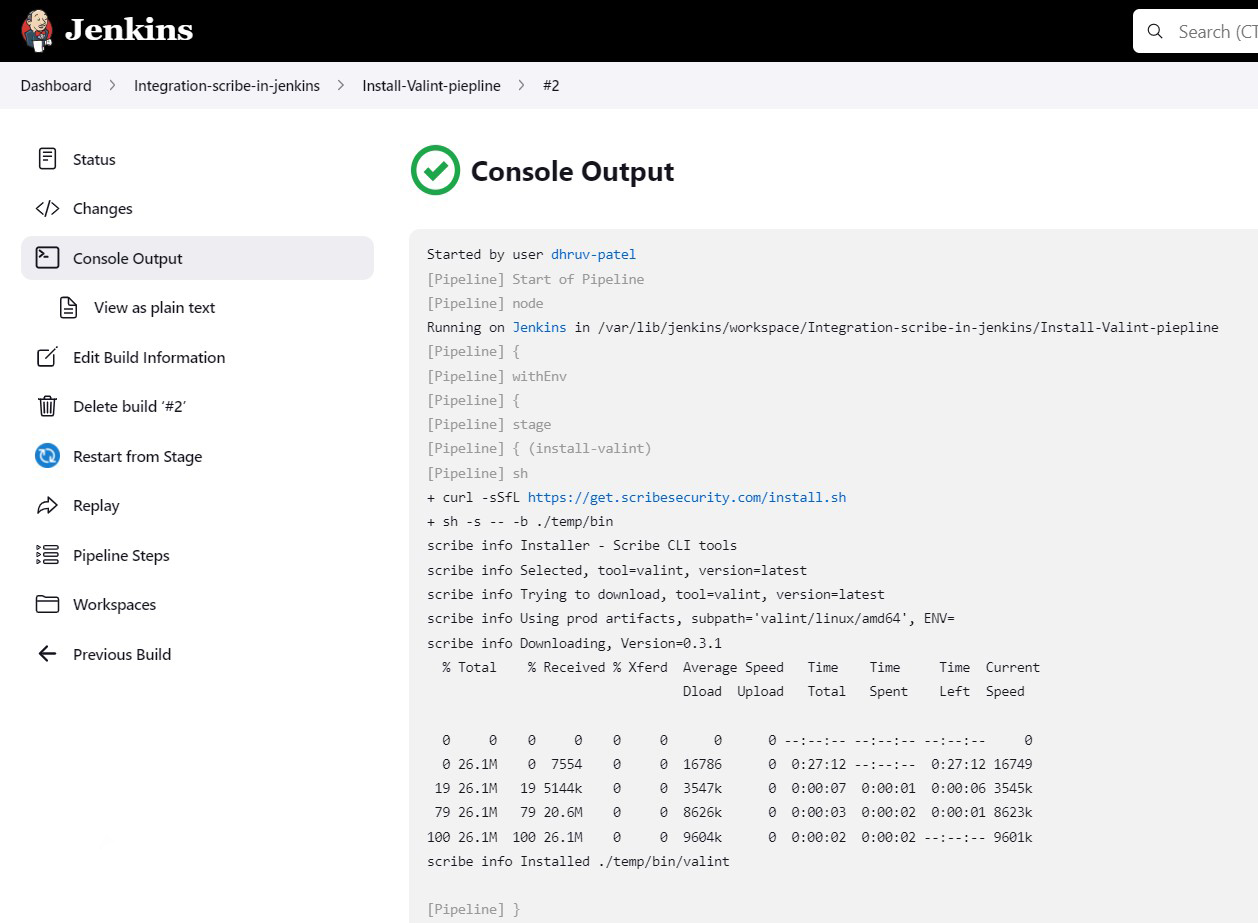
- Click on the '#' to see the pipeline log output
-
To add your own policies to the pipeline check out this guide.
-
To capture 3rd party tool results in the pipeline and turn it into evidence, check out this guide.
Where to go on Scribe Hub
Now that you've created your first set of evidence you can log into your Scribe Hub to view the results.
The first place you can look into to make sure your evidence has been uploaded properly is the Evidence report. The evidence report shows all the evidence you have collected and uploaded to Scribe Hub from all your pipelines and projects.
To see more details on your pipeline you can check out the Product page
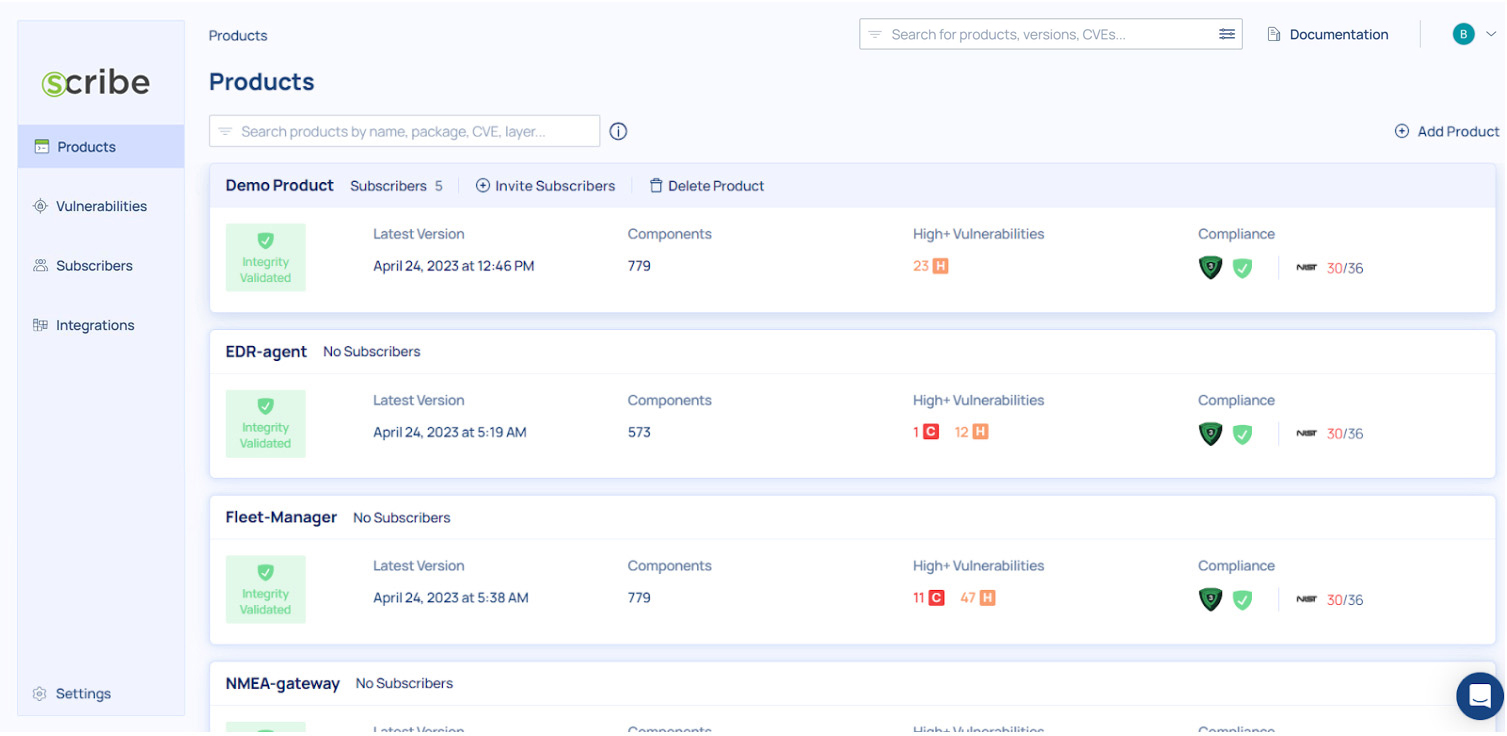
The products page shows you your products along with some basic information: How many subscribers have you added to this product, when the latest version of it was created (the last pipeline run), how many components were identified in the project, if the source code integrity was verified or not, how many high (or higher) vulnerabilities were identified, and how the project stands in terms of compliance to the SSDF and SLSA frameworks.
Clicking on a product will show you all the product's builds and their information:
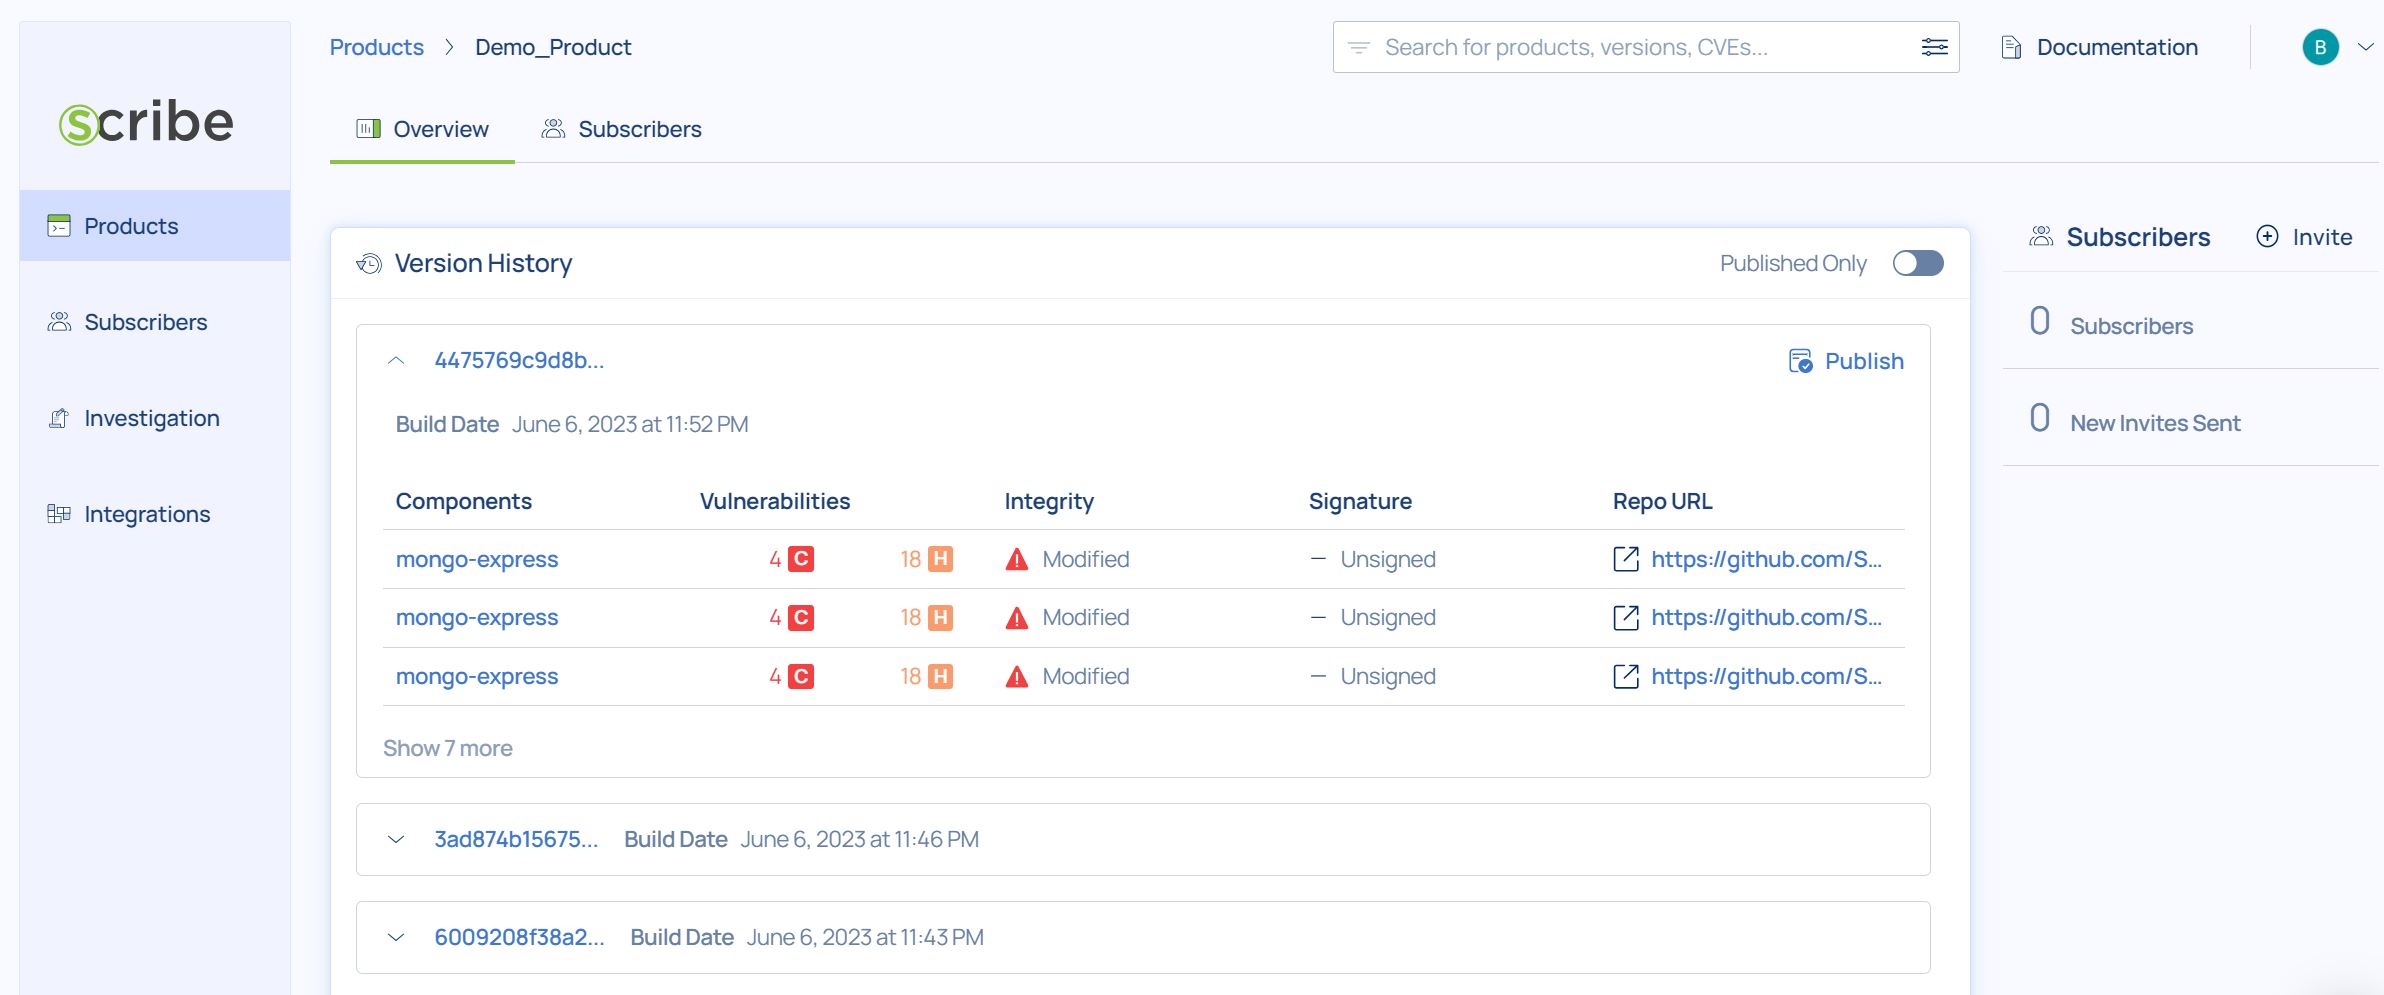
For each build you can see its version ID, the build date, if the source code integrity was verified or not, the number and severity of vulnerabilities, how that build stands in terms of compliance, whether the build was published and if its signature was verified.
for more information on the pipeline you just completed, click on the last build uploaded (the top of the list) and you'll get to the build dashboard:
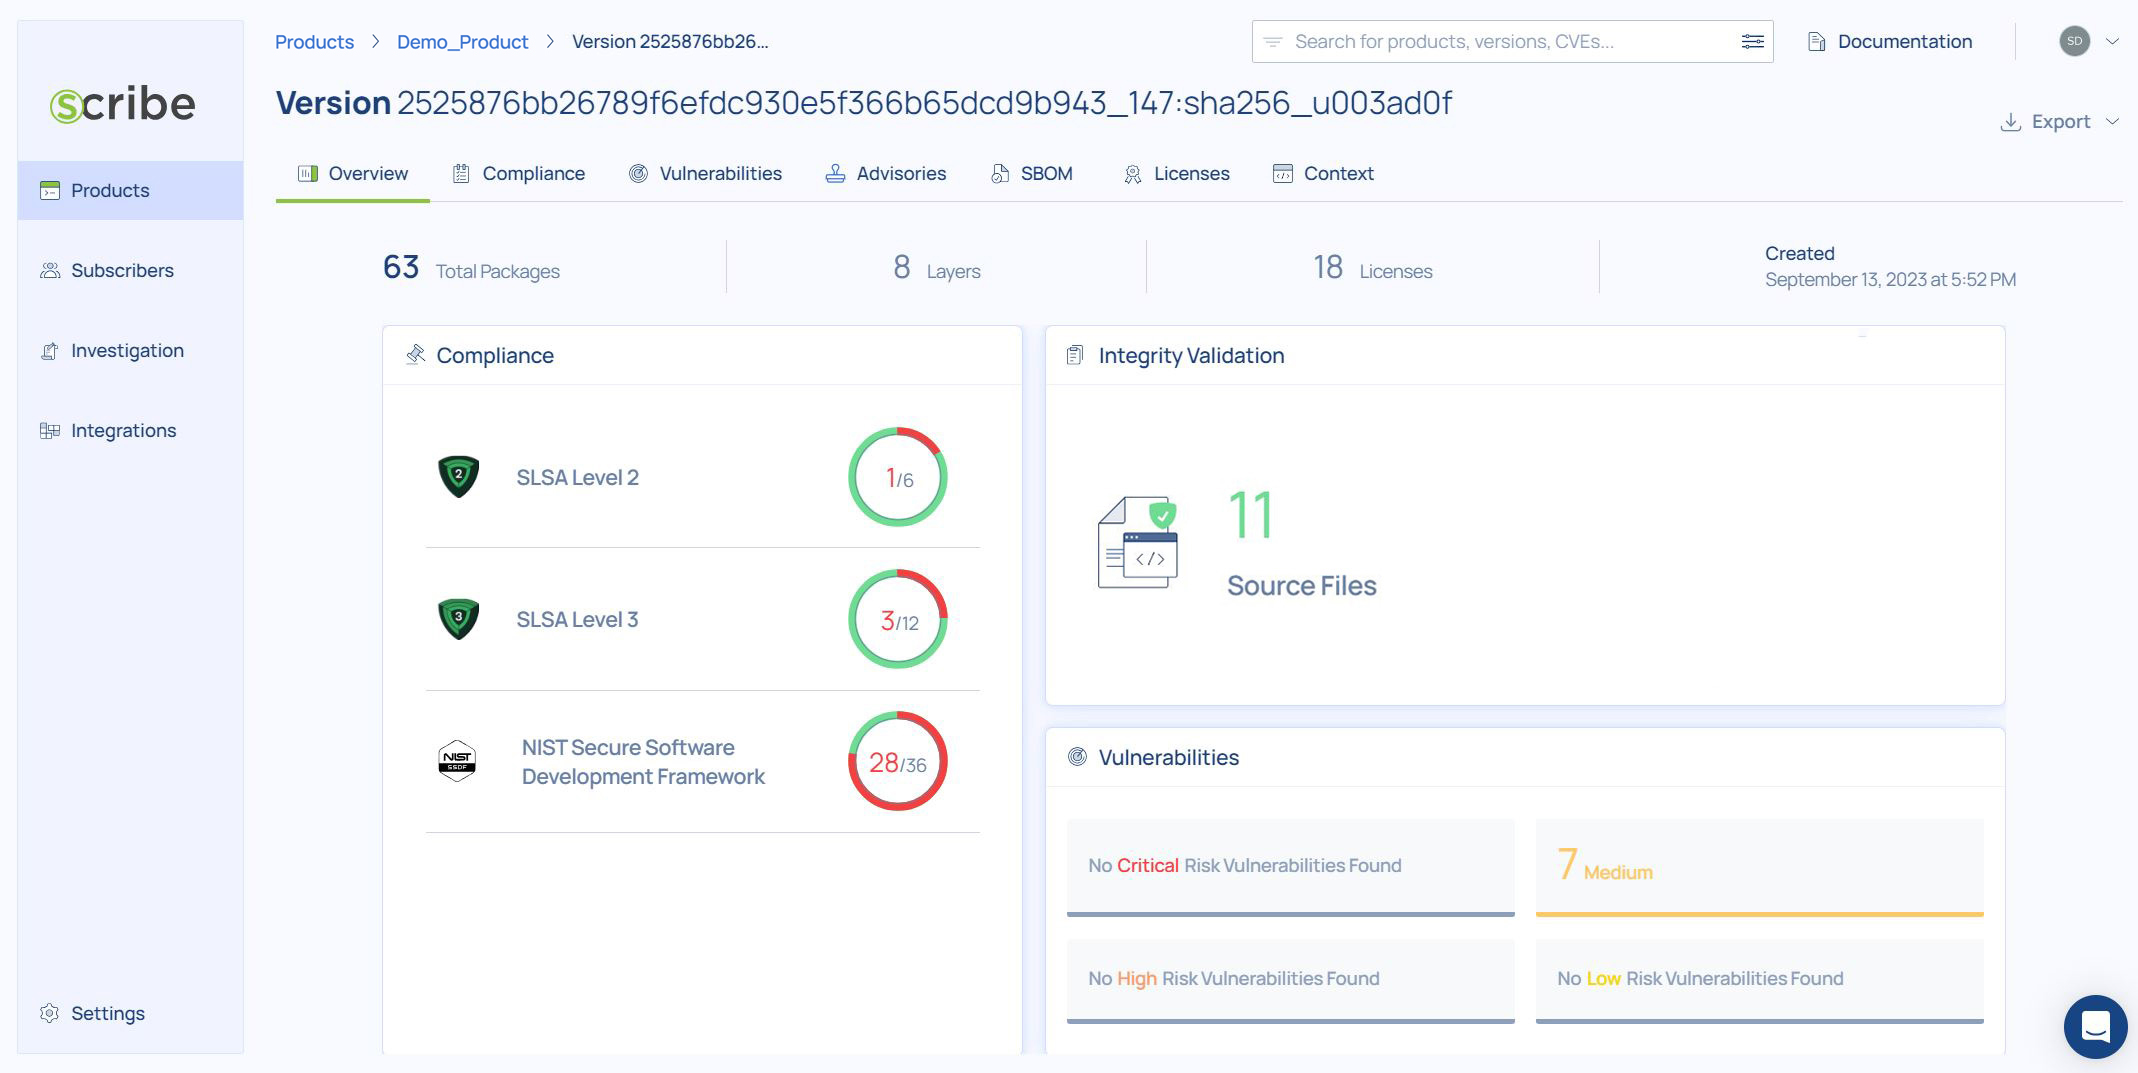
The dashboard is your main access to see this build's reports. You can see a summary of the build's compliance information to each of the frameworks, you can see a summary of the vulnerability information, and you can see the integrity validation information.
Where to go next
- To learn more about what you can see, learn, and access about your build and your product look at the reports guide section.
- To learn how to create and manage SBOMs and vulnerabilities go to this guide.
- To learn about Scribe's use of the SLSA framework go to this guide.
- To learn about enforcing SDLC policies go to this guide.
- To learn how to achieve SSDF compliance go to this guide.
- To learn how to secure your builds go to this guide.